Salvar raspando, un gráfico de barras anotado
En este posteo hago un gráfico de barras con anotaciones para mostrar un problema en el sistema de exámenes de las escuelas de Nueva York.
Diplopma Regents
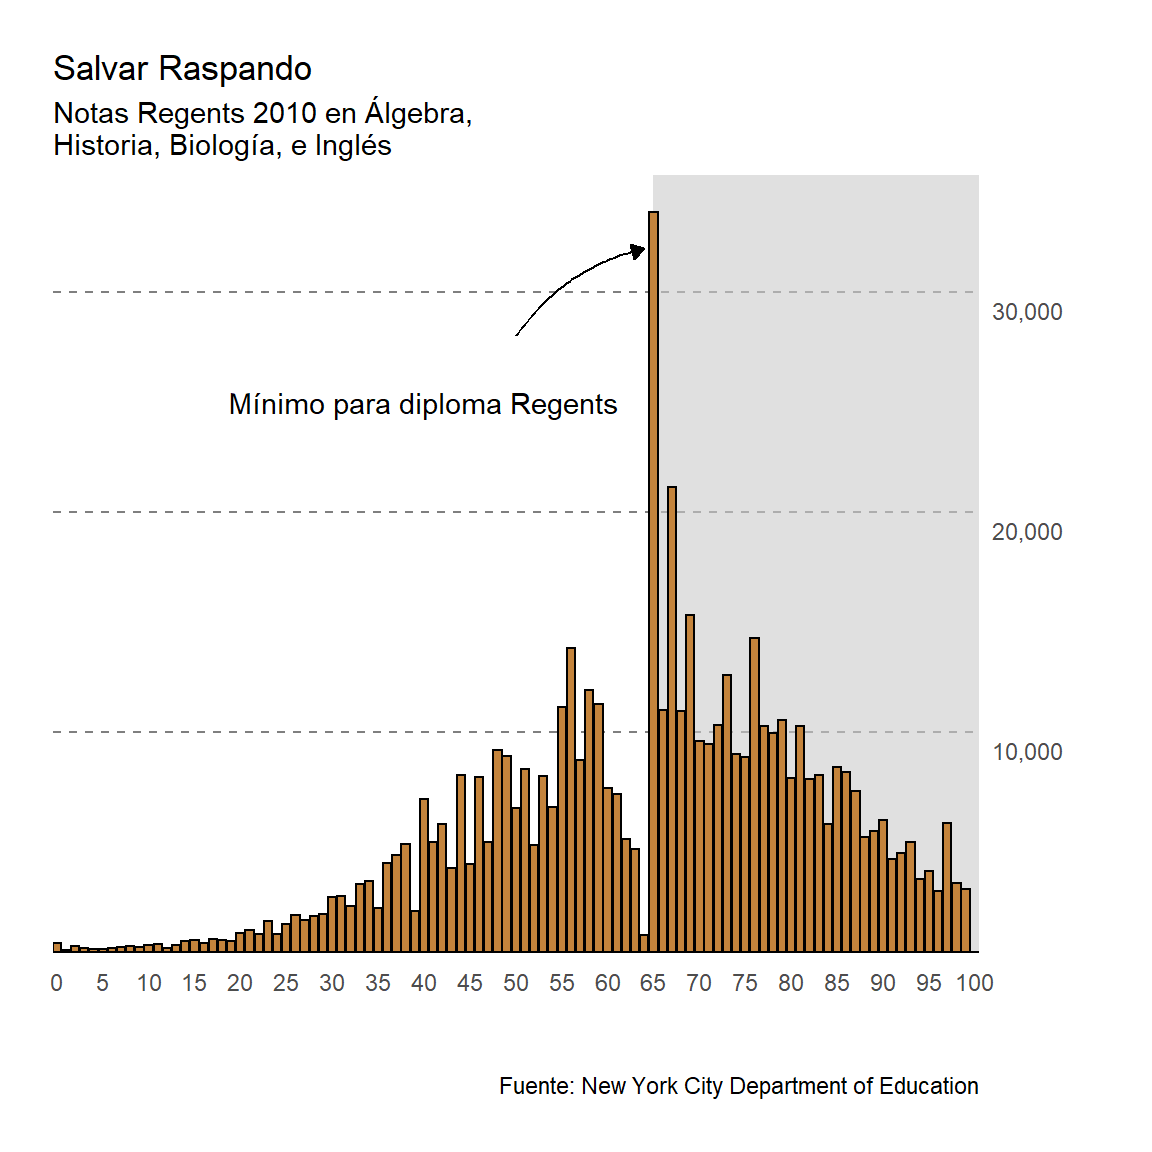
Los exámenes Regents son una serie de tests estándar de temas de secundaria en el estado de Nueva York. Este set de datos muestra las notas de exámenes en varias materias. Lo que llama la atención es que hay un gran número de examenes con 65, la nota mínima de aprobación.
nyc_regents <-  read_csv("nyc_regents.csv",
                          col_types=
                           cols(
                             score = col_double(),
                             integrated_algebra = col_double(),
                             global_history = col_double(),
                             living_environment = col_double(),
                             english = col_double(),
                             us_history = col_double()))

# reshape

nyc_reshape <- nyc_regents %>%
  gather(k="subject", v="tests", -score) %>%
  group_by(score) %>%
  summarize(tests = sum(tests, na.rm = TRUE))

# plot basico
g <- ggplot(nyc_reshape, aes(score, tests)) +
       geom_col()


g +
  labs(caption = "Source: New York City Department of Education",
       title = "Scraping By",
       subtitle = "2010 Regents scores on Algebra, \nGlobal History, Biology, English & US History",
       y = "", x = "") +
  scale_x_continuous(breaks = seq(0, 100, 5), expand = expansion(add = c(0, 0))) +
  scale_y_continuous(position = "right",
                     labels = scales::number_format(big.mark = ","), # function
                     breaks = c(1e4, 2e4, 3e4))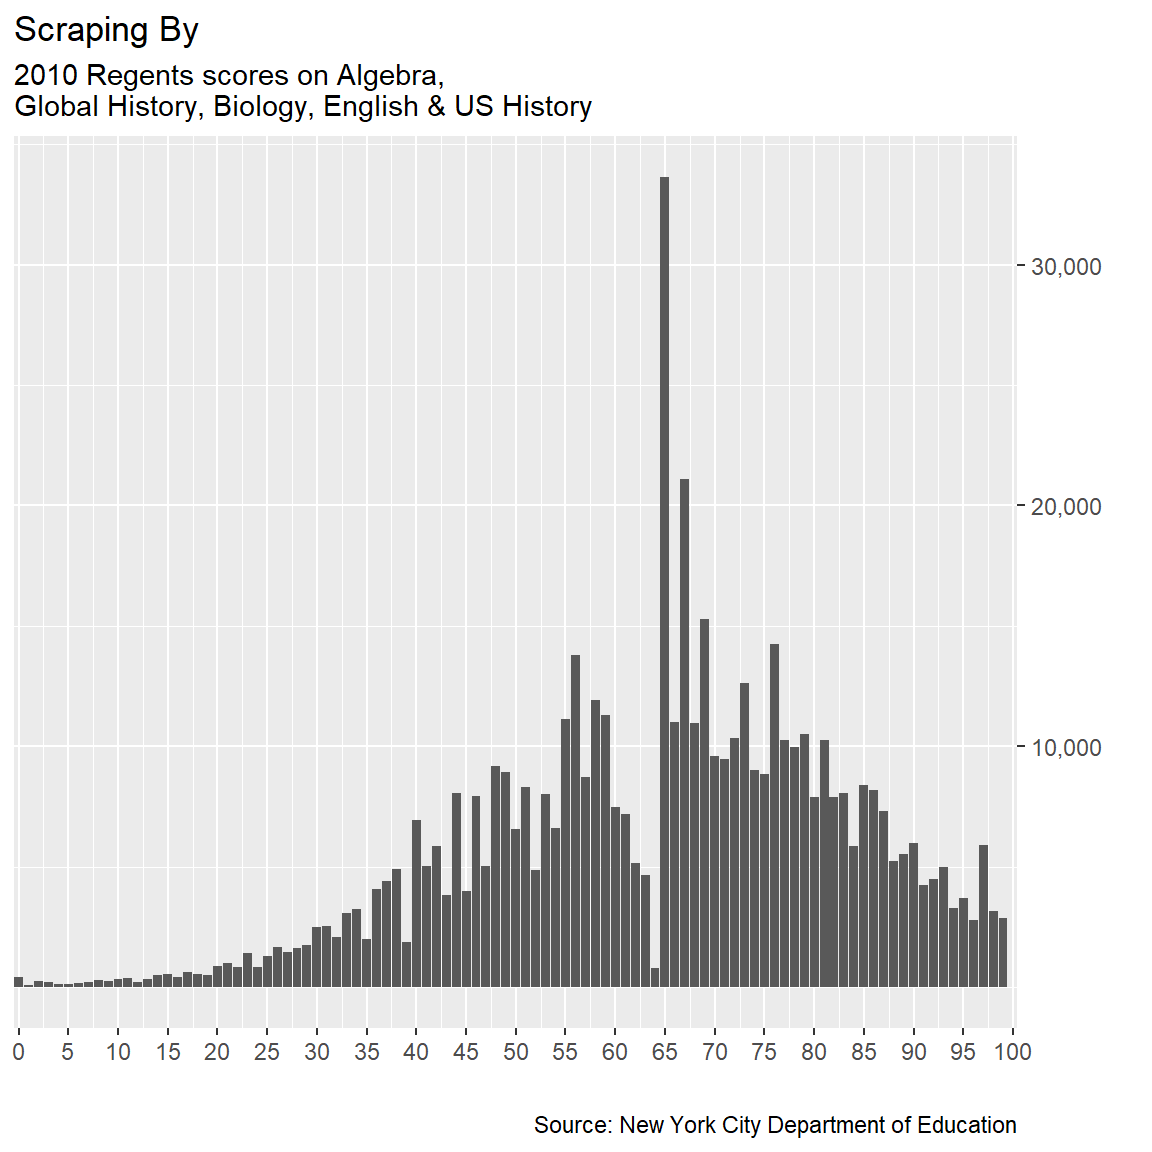
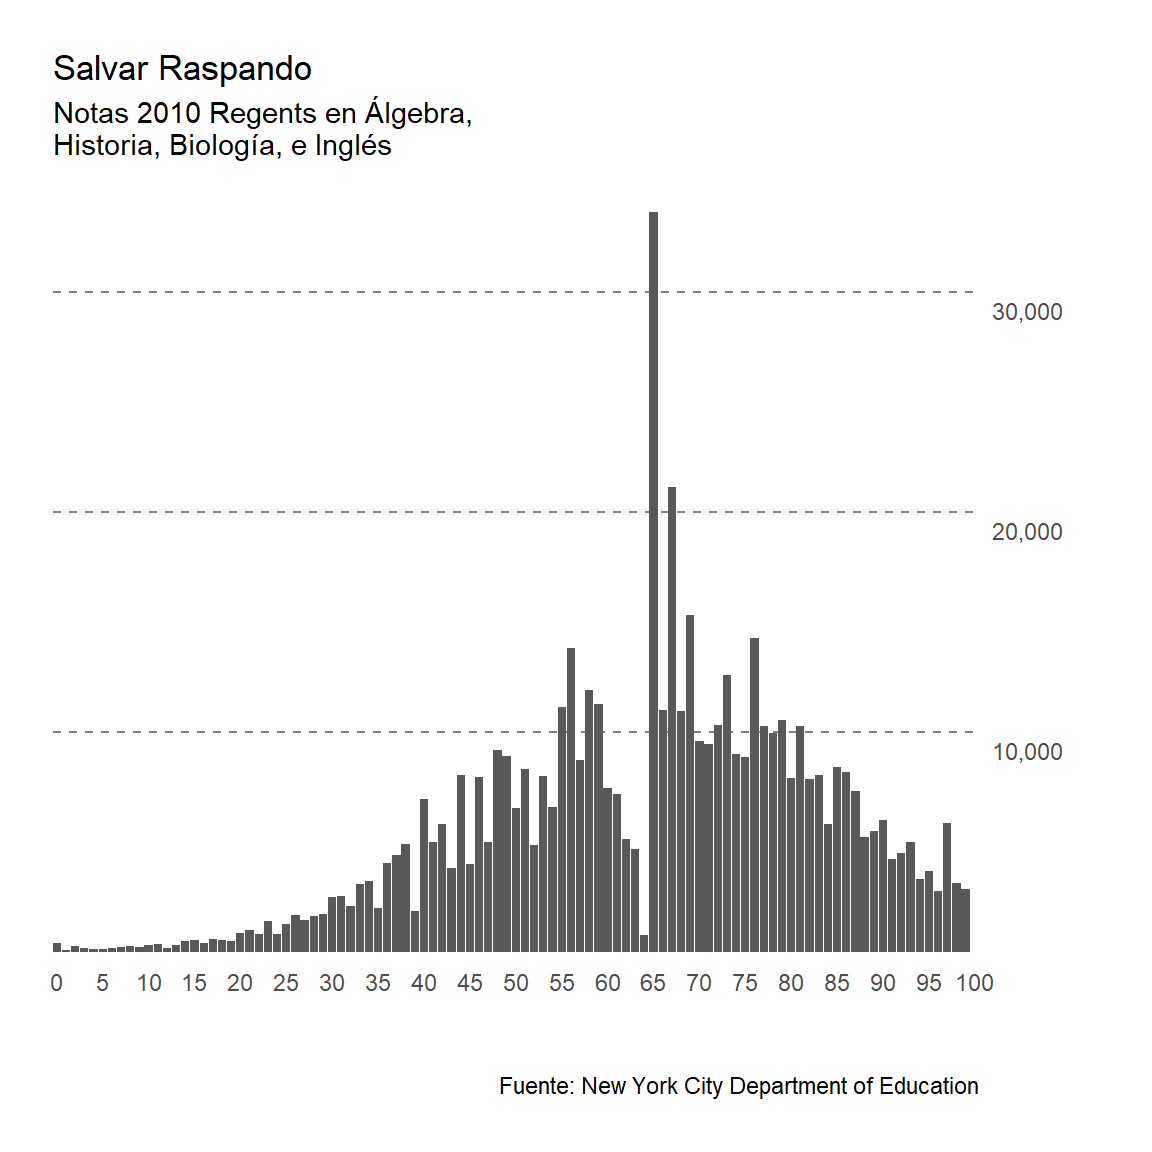
g + labs(caption = "Fuente: New York City Department of Education",
       title = "Salvar Raspando",
       subtitle = "Notas 2010 Regents en Álgebra, \nHistoria, Biología, e Inglés",
       y = "", x = "") +
  scale_x_continuous(breaks = seq(0, 100, 5), expand = expansion(add = c(0, 0))) +
  scale_y_continuous(position = "right",
                     labels = scales::number_format(big.mark = ","), # function
                     breaks = c(1e4, 2e4, 3e4)) +
  theme_minimal() +
  theme(
    panel.grid.major.y = element_line(linetype = "dashed", color = "gray50"),
    panel.grid.major.x = element_blank(),
    panel.grid.minor = element_blank(),
    axis.text.y = element_text(vjust = 1.5),
    axis.text.x = element_text(vjust = 7),
    plot.margin = margin(unit(c(20, 20, 20, 20), "cm"))
  )
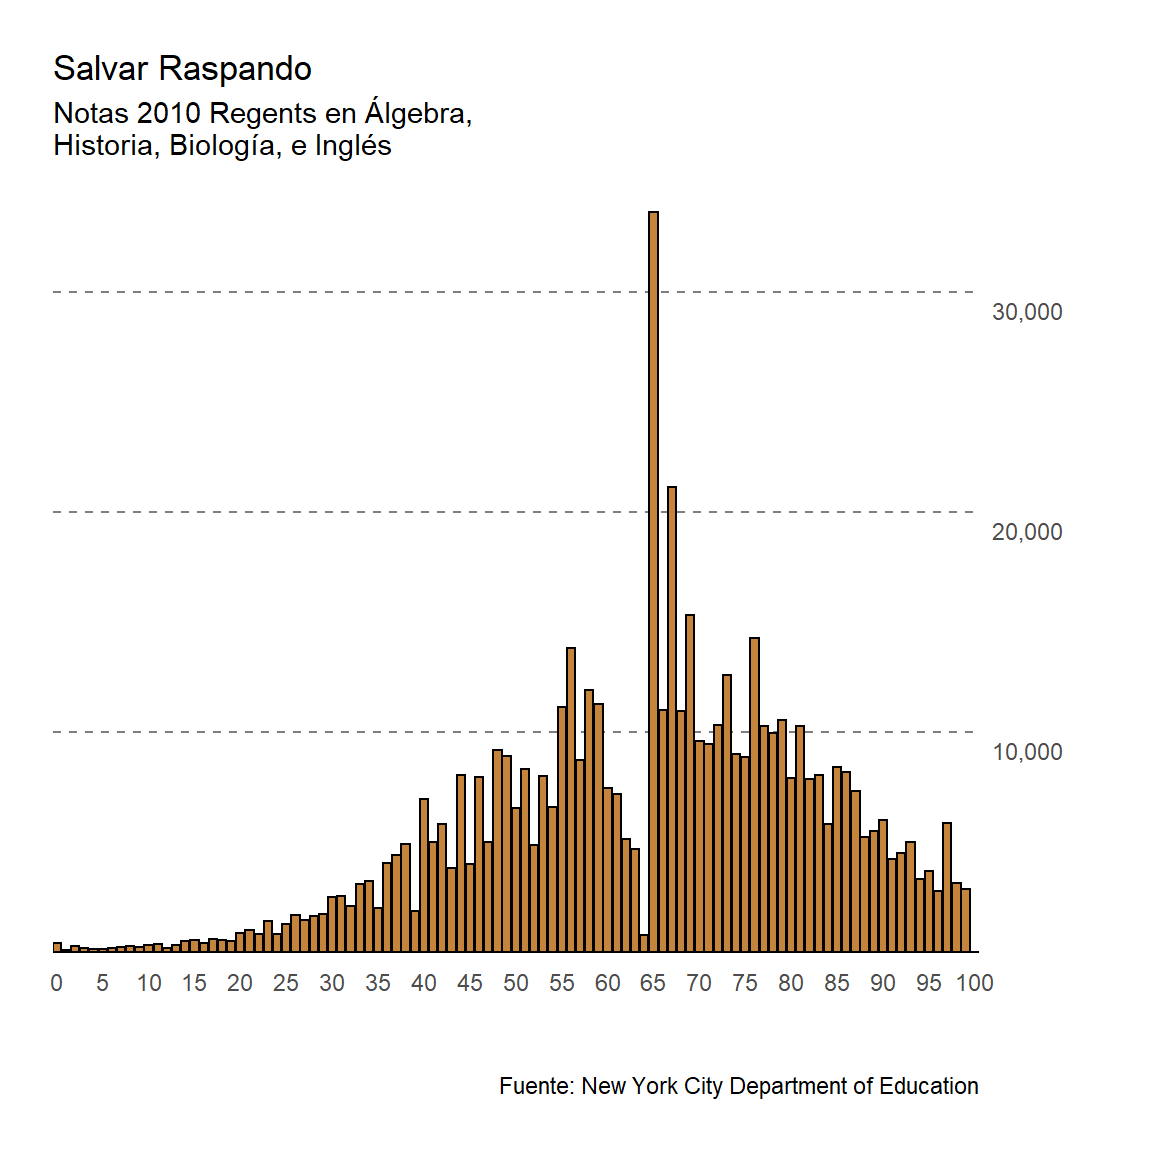
# color a las columnas
ggplot(nyc_reshape, aes(score, tests)) +
  geom_col(color = "black", fill = "#C4843C") +
  labs(caption = "Fuente: New York City Department of Education",
       title = "Salvar Raspando",
       subtitle = "Notas 2010 Regents en Álgebra, \nHistoria, Biología, e Inglés",
       y = "", x = "") +
  scale_x_continuous(breaks = seq(0, 100, 5), expand = expansion(add = c(0, 0))) +
  scale_y_continuous(position = "right",
                     labels = scales::number_format(big.mark = ","), # function
                     breaks = c(1e4, 2e4, 3e4)) +
  theme_minimal() +
  theme(
    panel.grid.major.y = element_line(linetype = "dashed", color = "gray50"),
    panel.grid.major.x = element_blank(),
    panel.grid.minor = element_blank(),
    axis.text.y = element_text(vjust = 1.5),
    axis.text.x = element_text(vjust = 7),
    plot.margin = margin(unit(c(20, 20, 20, 20), "cm"))
  )
# Todo junto
nyc_regents %>%
  gather(k="k", v="v", -score) %>%
  group_by(score) %>%
  summarize(v = sum(v, na.rm = TRUE)) %>%
  ggplot(aes(score, v)) +
  annotate("rect", xmin = 65, xmax=Inf, ymin=0, ymax=Inf, alpha = 0.6, fill = "grey80") +
  annotate("text",
           label = "Mínimo para diploma Regents",
           x = 40, y = 2.5e4) +
  annotate("curve",
           curvature=-.2,
           arrow=arrow(type = "closed",
                       length = unit(0.2, "cm")),
           x=50, y=2.8e4, xend=64, yend=3.2e4) +
  geom_col(color = "black", fill = "#C4843C") +
  theme_minimal() +
  scale_x_continuous(breaks = seq(0, 100, 5), expand = expansion(add = c(0, 0))) +
  scale_y_continuous(position = "right",
                     labels = scales::number_format(big.mark = ","), # function
                     breaks = c(1e4, 2e4, 3e4)) +
  labs(caption = "Fuente: New York City Department of Education",
       title = "Salvar Raspando",
       subtitle = "Notas Regents 2010 en Álgebra, \nHistoria, Biología, e Inglés",
       y = "", x = "") +
  labs(y = "", x = "") +
  theme(
    panel.grid.major.y = element_line(linetype = "dashed", color = "gray50"),
    panel.grid.major.x = element_blank(),
    panel.grid.minor = element_blank(),
    axis.text.y = element_text(vjust = 1.5),
    axis.text.x = element_text(vjust = 7),
    plot.margin = margin(unit(c(20, 20, 20, 20), "cm")) #
  )